
You publish a post you’re proud of, open Insights the next day, and the views are half of what you usually get. Was the post weak? Did the algorithm bury it? Before jumping to conclusions, it helps to know exactly what each number counts. A lot of worries disappear once you do.
We’ll start with where to find Insights and how account and post insights differ, then go through views, interactions, followers and traffic sources one by one. At the end, we’ll look at what Insights can’t tell you, and how to fill the gap.
Where to find Insights: account vs post
Open your profile in the Threads app or on the web to find Insights. For a single post, open that post’s own insights.
The two views mean slightly different things. Account insights cover the date range you pick. Post insights are a running total since the post went live. Older posts keep getting seen, so adding up the views of this week’s posts usually won’t match your account’s views for the week.
Meta lets you compare performance over 7 to 90 days. If you want to see six months or a year, you’ll need to keep your own records. More on that at the end.
Views count views, not people
Views are the number of times your post was seen. The same person can be counted more than once, so views aren’t the number of people who saw it.
If Insights splits views into followers and non-followers, that split is worth a look. The higher the non-follower share, the further the post travelled beyond people who already know you.
Interactions: read each type on its own
Meta counts likes, replies, reposts and quotes as interactions. They don’t carry the same weight: a like takes a second, while a reply means someone stopped to think. If conversation is what you’re after, look at replies separately.
Many people also track an engagement rate. Threads Analytics calculates it as (likes + replies + reposts + quotes) ÷ views, with shares counted separately. Other tools may use a different formula, so check before comparing numbers across tools.
One trap to watch for: a higher engagement rate isn’t always good news. If views drop sharply while interactions stay the same, the rate goes up too. Whenever you look at a ratio, glance at both the top and bottom numbers.
Followers: growth and composition
Follower count tells you whether your audience is growing. Insights can also break followers down by country, city, age and gender, which helps you check whether your real readers match the audience you had in mind.
Demographics need a minimum audience before they appear. Through the API, the threshold is 100 followers, so an empty chart on a smaller account is normal.
Traffic sources tell you where, not why
Insights groups views by source, such as Home, Profile, Search and Other. Home is the feed, Profile is people visiting your profile, and Search is views from search results. Meta also notes that eligible posts can be discovered on Instagram and Facebook.
Search doesn’t show what people typed, so a bigger Search share doesn’t necessarily mean more people are looking you up by name. And always read shares next to the actual counts. If Home views fall sharply, Search’s share rises even when its views haven’t changed at all.
When the numbers look off
If you can’t find Insights, make sure you’re on the right account, update the app and try the web version. If it’s still missing, check the Help Center in the app.
If the numbers are lower than expected, don’t rush to a verdict. Insights isn’t always real-time, and a new post may still be collecting views. Rolling ranges are another common cause: a range like the last 7 days drops its oldest day every day, so if a strong day just fell out, the total drops even though nothing changed.
If you think your reach really has dropped, Why Threads reach drops has a fuller checklist.
What Insights can’t tell you
Insights is good at telling you what happened. It’s less helpful with why, or what to do next. Which hour works best for you, whether images beat text, how long posts compare with short ones: answering these means grouping many posts and comparing them. Best time to post on Threads walks through it for posting times.
Time is the other limit. Insights compares at most 90 days, and past daily follower counts can’t be recovered once missed. The only way to see long-term trends is to start recording now.
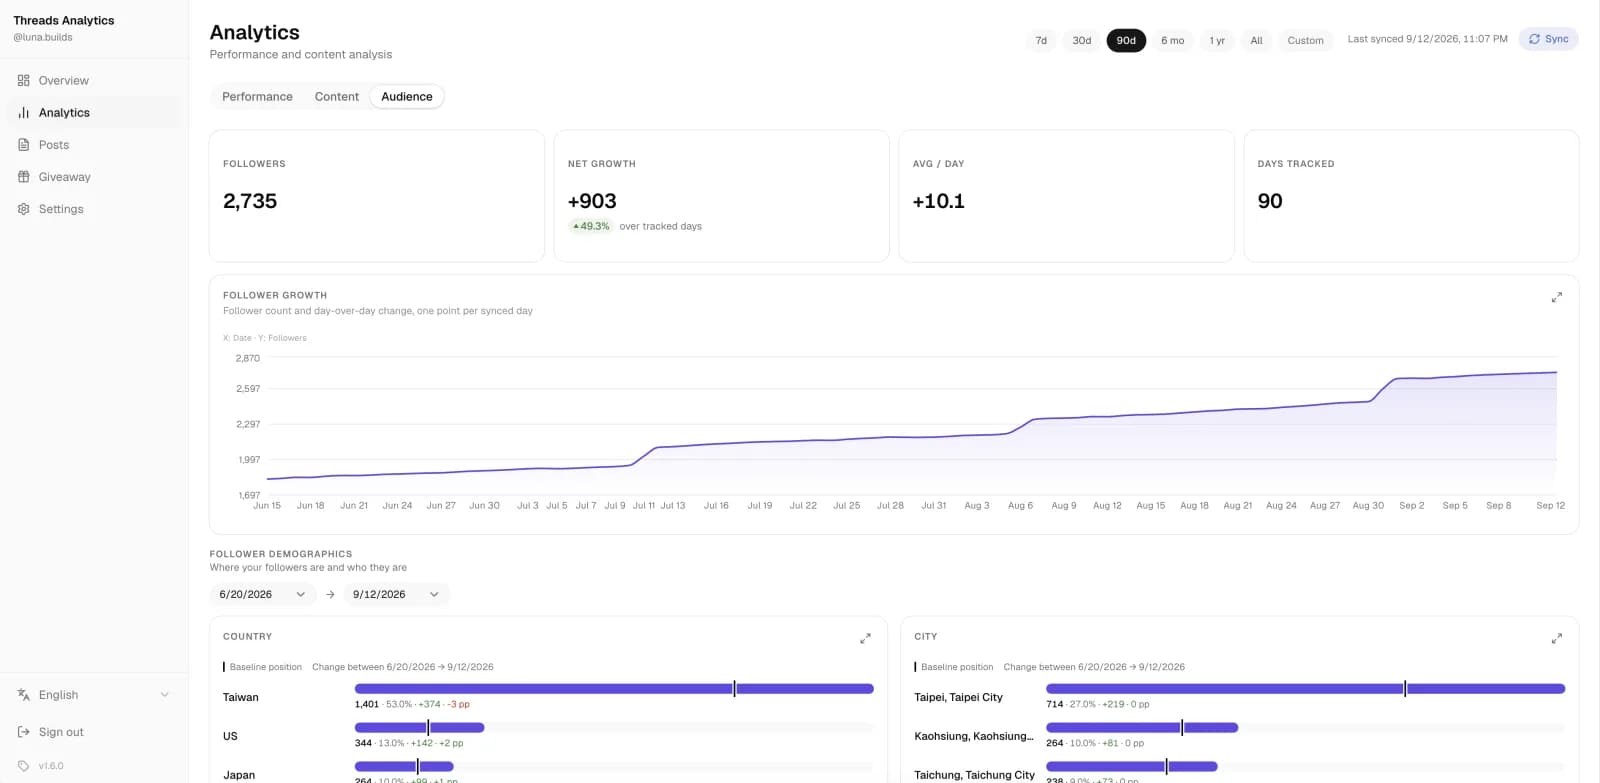
That’s the gap Threads Analytics fills. It’s a free, open-source Threads analytics dashboard you host yourself. It syncs your posts and metrics through the official API, saves a daily follower and demographic snapshot, and groups your posts by time, format and length automatically. The software is free; you only pay for your own hosting and database.
Older posts can be synced at any time, but daily follower history starts from your first sync. Earlier days can’t be filled in, so the sooner you start, the better.
Compare against yourself
The numbers in Insights aren’t hard to understand. The hard part is not reading too much into them. Remember that views count views, that interactions are worth reading type by type, and that traffic sources only tell you where people came from. Compare against your own past results rather than other accounts, and Insights becomes a lot more useful.
Frequently asked questions
What does 'Search' mean in Threads Insights?
It’s the share of views that came from Threads search. It doesn’t show what people searched for, so a higher share doesn’t necessarily mean more people are looking you up by name.
What is the difference between views and reach?
Views count how many times a post was seen. Reach usually means how many different people saw it. Threads Insights reports views. Views divided by followers is a useful ratio, but it isn’t a reach rate.
Can I see Threads Insights older than 90 days?
Insights compares up to 90 days at a time. Your older posts are still there, and a tool using the API can fetch them, but past daily follower counts can’t be recovered. They can only be recorded from now on.
Is there a free Threads analytics tool?
Yes. Threads Analytics is free and open source. You host it yourself, so you’ll need a server, a PostgreSQL database and a Threads access token. Hosting and database providers may charge for their services.
References
- New Threads features announcement
The basis for how this guide describes official Insights features. Features and labels change over time, so check your own account.
- How Threads Analytics calculates its charts
The comparisons in this guide are practical checks, not controlled experiments.