
A few posts in a row come in below your usual views, and the doubts start. Have you been restricted? Did the algorithm change?
Hold on. To find out whether your account is restricted, check the account status in your Threads settings; that’s more reliable than guessing from numbers. Views can drop for many reasons: you posted less, your content shifted, or a strong day just left the date range. Any of these can make the numbers look worse without anything being wrong with your account.
A note on wording: when people say their reach dropped, they usually mean their views did. Threads counts views, not the number of people who saw a post, so this guide works with views and checks each cause using your own data. For what each Insights number means, see Threads Insights explained.
First, make sure it’s a real drop
One slow week isn’t a trend. Start by comparing two periods of the same length, and look beyond the total. Four numbers matter: median views per post, average views per post, total views and the number of posts.
Put together, they tell you a lot. In this example, total views fall even though reach hasn’t changed:
| Last month | This month | |
|---|---|---|
| Posts | 20 | 12 |
| Total views | 48,000 | 30,000 |
| Median views per post | 1,800 | 1,850 |
| Average views per post | 2,400 | 2,500 |
Total views fell by nearly 40%, which looks alarming. But the median and average per post barely moved. The only real difference is eight fewer posts. Here the issue isn’t reach, it’s volume.
Two other false alarms are worth ruling out. One is the rolling range, a window like “the last 30 days” that moves forward one day at a time. As soon as a peak day slides out, the total drops, even if your recent posts are doing just as well. The other is very recent posts, which are still collecting views and drag the numbers down. Leave out anything from the last few days.
Five changes worth checking
If the drop is real, these are the places to look. Each one is a hypothesis you can test with data, not a verdict on what the algorithm did.
Your format or topic shifted
Compare posts of the same format and topic. If your mix changed, say fewer images and more text, the overall median can move even when each type performs exactly as before.
Your posting rhythm changed
The table above covered how many posts you publish; this is about spacing, such as a break of a week or two, or a switch from daily posts to weekend bursts. In Threads Analytics, the Posting Activity and Posting Gap vs Performance charts show this. If views dipped after a break, check whether your topics or formats changed around the same time too.
Your posting time moved
See whether you started posting at different hours, and compare similar posts across them. Best time to post on Threads covers this step by step.
More links, fewer questions
Within the same topic and format, compare posts with and without links, or with and without a question. Every audience reacts differently, and your own numbers will show whether it matters for yours.
Something changed on the platform
Check Threads’ official announcements and the account status in your settings. If many accounts report a drop at the same time, a platform change is worth watching. And make sure your data syncs didn’t fail.
Narrowing it down with charts
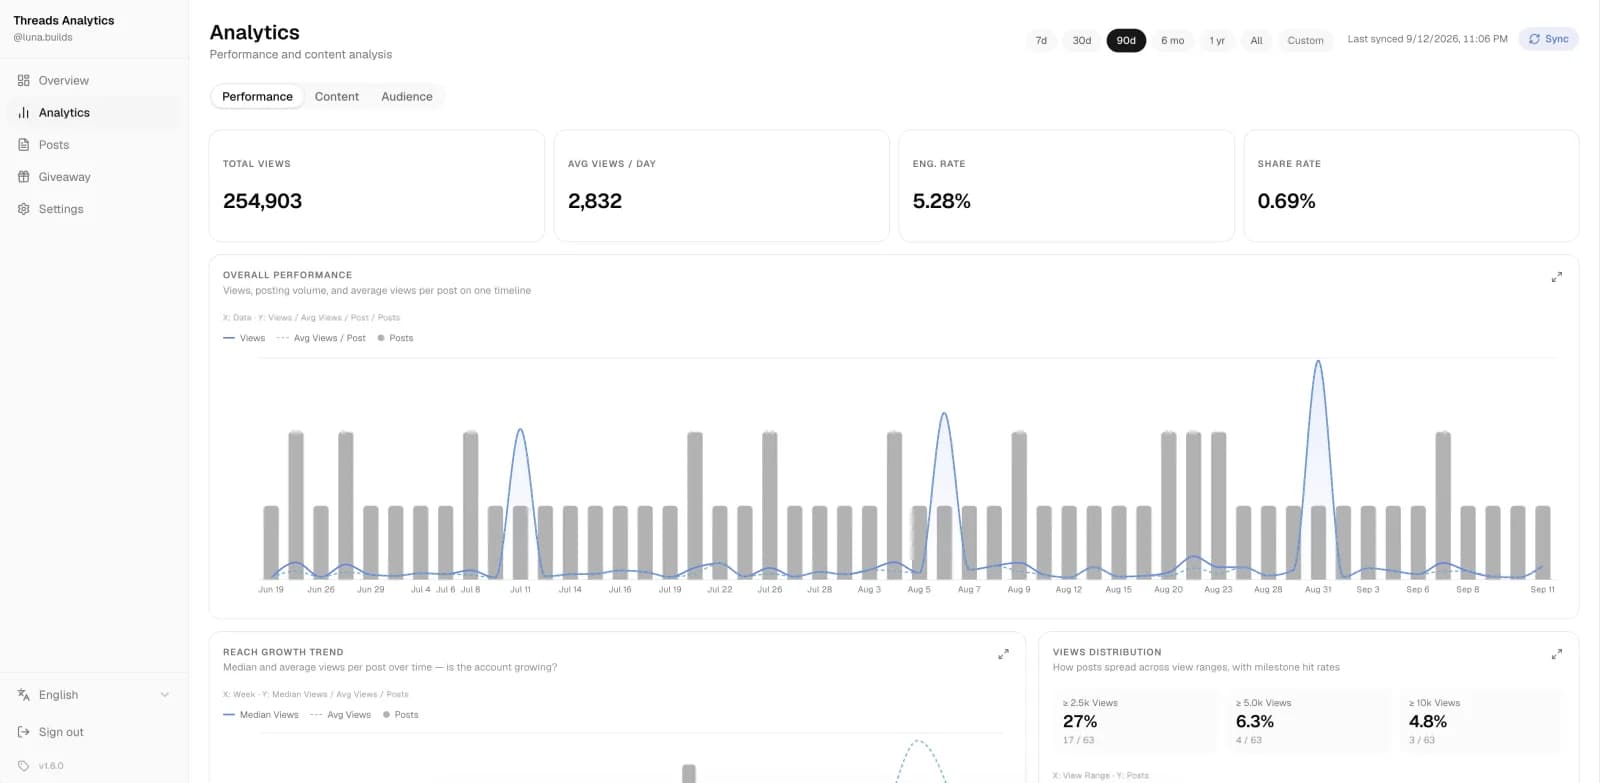
Once you have a direction, charts can help confirm it. The examples below use charts from Threads Analytics.
Reach Growth Trend and Views Distribution show where the change is. If the median holds, you may simply have lost a few breakout posts. If the median itself is sliding, the change is more likely across the board.
The Post Quality Map is a scatter chart: each dot is one post, with views along the bottom and engagement rate up the side. Low views with a high engagement rate means the people who saw the post responded well. With few views, though, a handful of interactions can swing the rate a lot, so check the actual counts.
If Insights splits views by followers and non-followers, compare the counts, not just the percentages. A falling share can simply mean the other group grew.
Testing a change you can measure
Once you have a likely cause, change one thing at a time so you know what worked. Pick a posting pace you can keep, hold topics and formats steady, and give it at least two weeks, longer if you post less often.
On the content side, try making the next post more useful: make the point clear, reply to thoughtful comments, and when it fits, ask a question you actually want answered rather than asking for likes. Put links where readers need them instead of hiding them because of algorithm rumours.
Finally, write down what you changed so you can compare it with similar posts later.
Building your own baseline
Telling whether views really dropped depends on knowing what normal looks like, and that takes a steady record.
Threads Analytics stores the posts and metrics the official API provides, and builds up follower history every day from your first sync. Reach Growth Trend and Views Distribution in the Performance tab, plus Content Feature Comparison and Posting Gap vs Performance in the Content tab, turn the checklist above into a few charts. The Overview summary also compares this period with the previous one, which makes it a good starting point.
Two caveats: the traffic source breakdown from official Insights isn’t shown in the dashboard, and if some syncs failed, keep that in mind when comparing periods.
Look at the data before you conclude
When views drop, the most important thing is not to let worry get ahead of the data. Often the answer is in your post volume, content mix, rhythm or timing. If none of those explains it, check your account status and official announcements.
Frequently asked questions
Does Threads shadowban accounts?
A drop in views alone won’t tell you. Check the account status in your Threads settings first, then compare equal periods and make sure your data is complete. Look for restrictions in Threads itself rather than reading them into a chart.
How is Threads reach rate calculated?
It depends on the definition. Views ÷ followers is a common ratio, but it isn’t unique reach and can go over 100%. Views ÷ your median views shows how a post did compared with your usual. Neither tells you how many different people saw it.
What is a normal Threads reach rate?
There’s no universal normal. Other accounts’ benchmarks only help if the metric, audience and format match. Your own median is the best reference point. Track it over time as your account grows.
Should I delete posts with low views?
No. Low views alone aren’t a reason to delete, and keeping the post gives you data to compare against later.
References
- How Threads Analytics calculates its charts
The comparisons in this guide are practical checks, not controlled experiments.